

STROBE LIGHT COMPARISON
“All you need to remember about Guide Number is not to use it as a guide for buying a strobe. The Guide Number is determined both by the light output and the spread of the beam. A focused beam produces a much higher Guide Number than a widely spread beam, yet the latter is more desirable underwater.” Alex Mustard in Underwater Photography Masterclass (2016)
Intro
This study investigates the characteristics of the light beam on different strobes, which aren’t revealed in standard specifications, but have the most impact on the quality and look of your images.
In this study, we compare strobe light output on land. We measure power at different points and compare light beam shapes with and without diffusers.
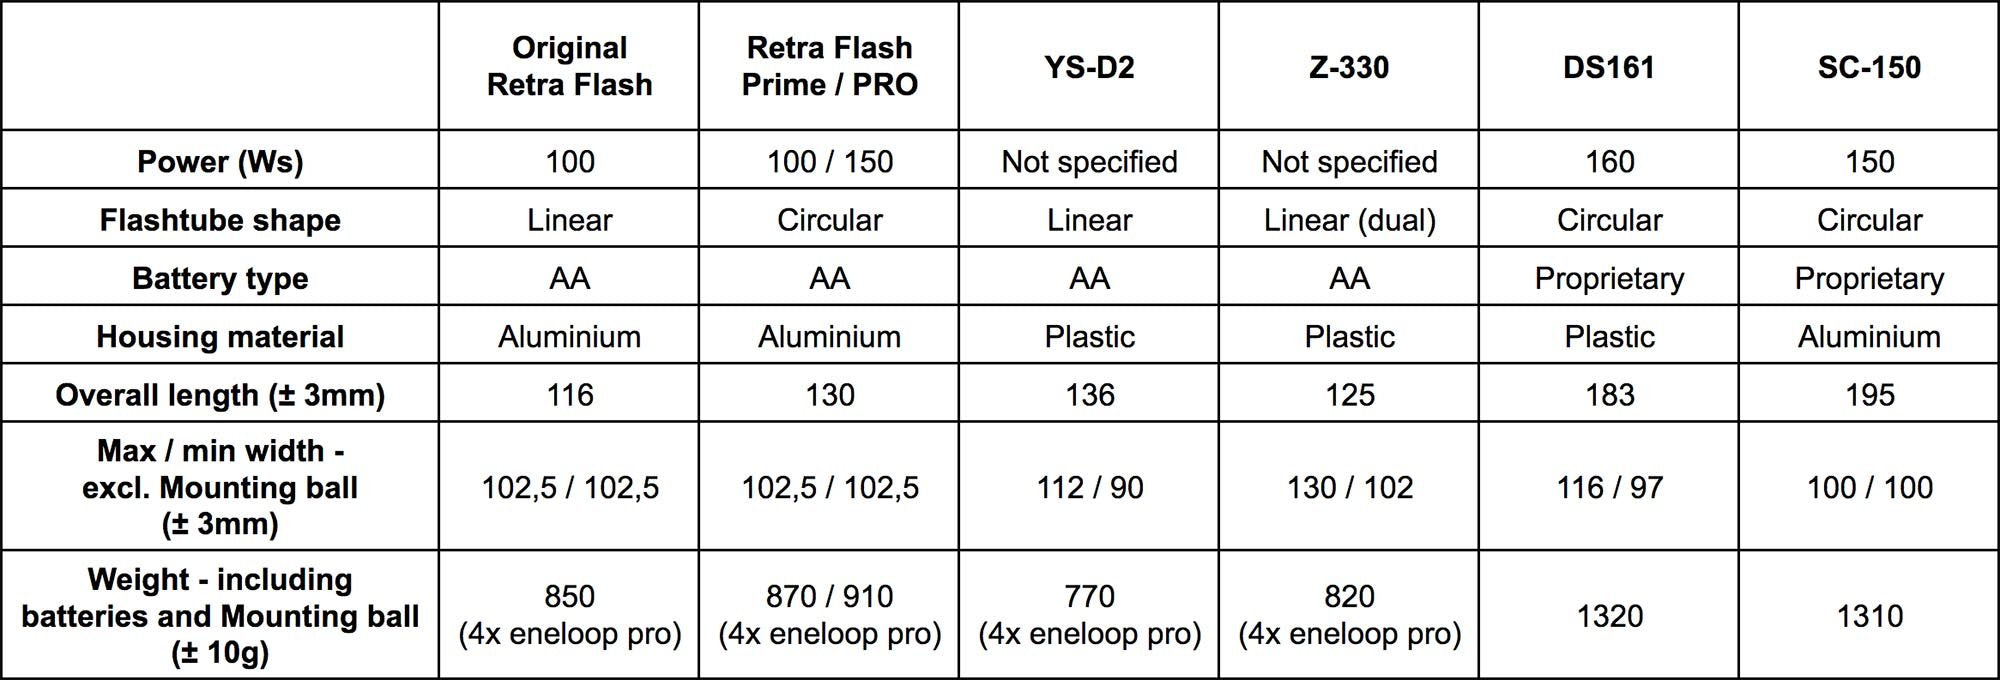
Firstly, we measured the physical dimensions of the strobes that we tested. We listed the basic information about the strobes in the table below. These tests are concerned with the more powerful, higher specification models.
BEAM SPREAD COMPARISON: PHOTOGRAPHED
"The absolute power is also not so important because with most good flashguns we don’t use them on full power much. However, the quality of light, determined by pattern of the beam, always affects our photos on all powers. All good underwater flashguns give a wide coverage, but still differ in how much of their light they get out to the wider parts of the beam. A wide, even beam gives a better quality of light, without unsightly hotspots and produces a more even illumination on the subject in wide angle photography. These flashguns are also easier to use, being more forgiving of slight errors in how you position them.”
- Alex Mustard
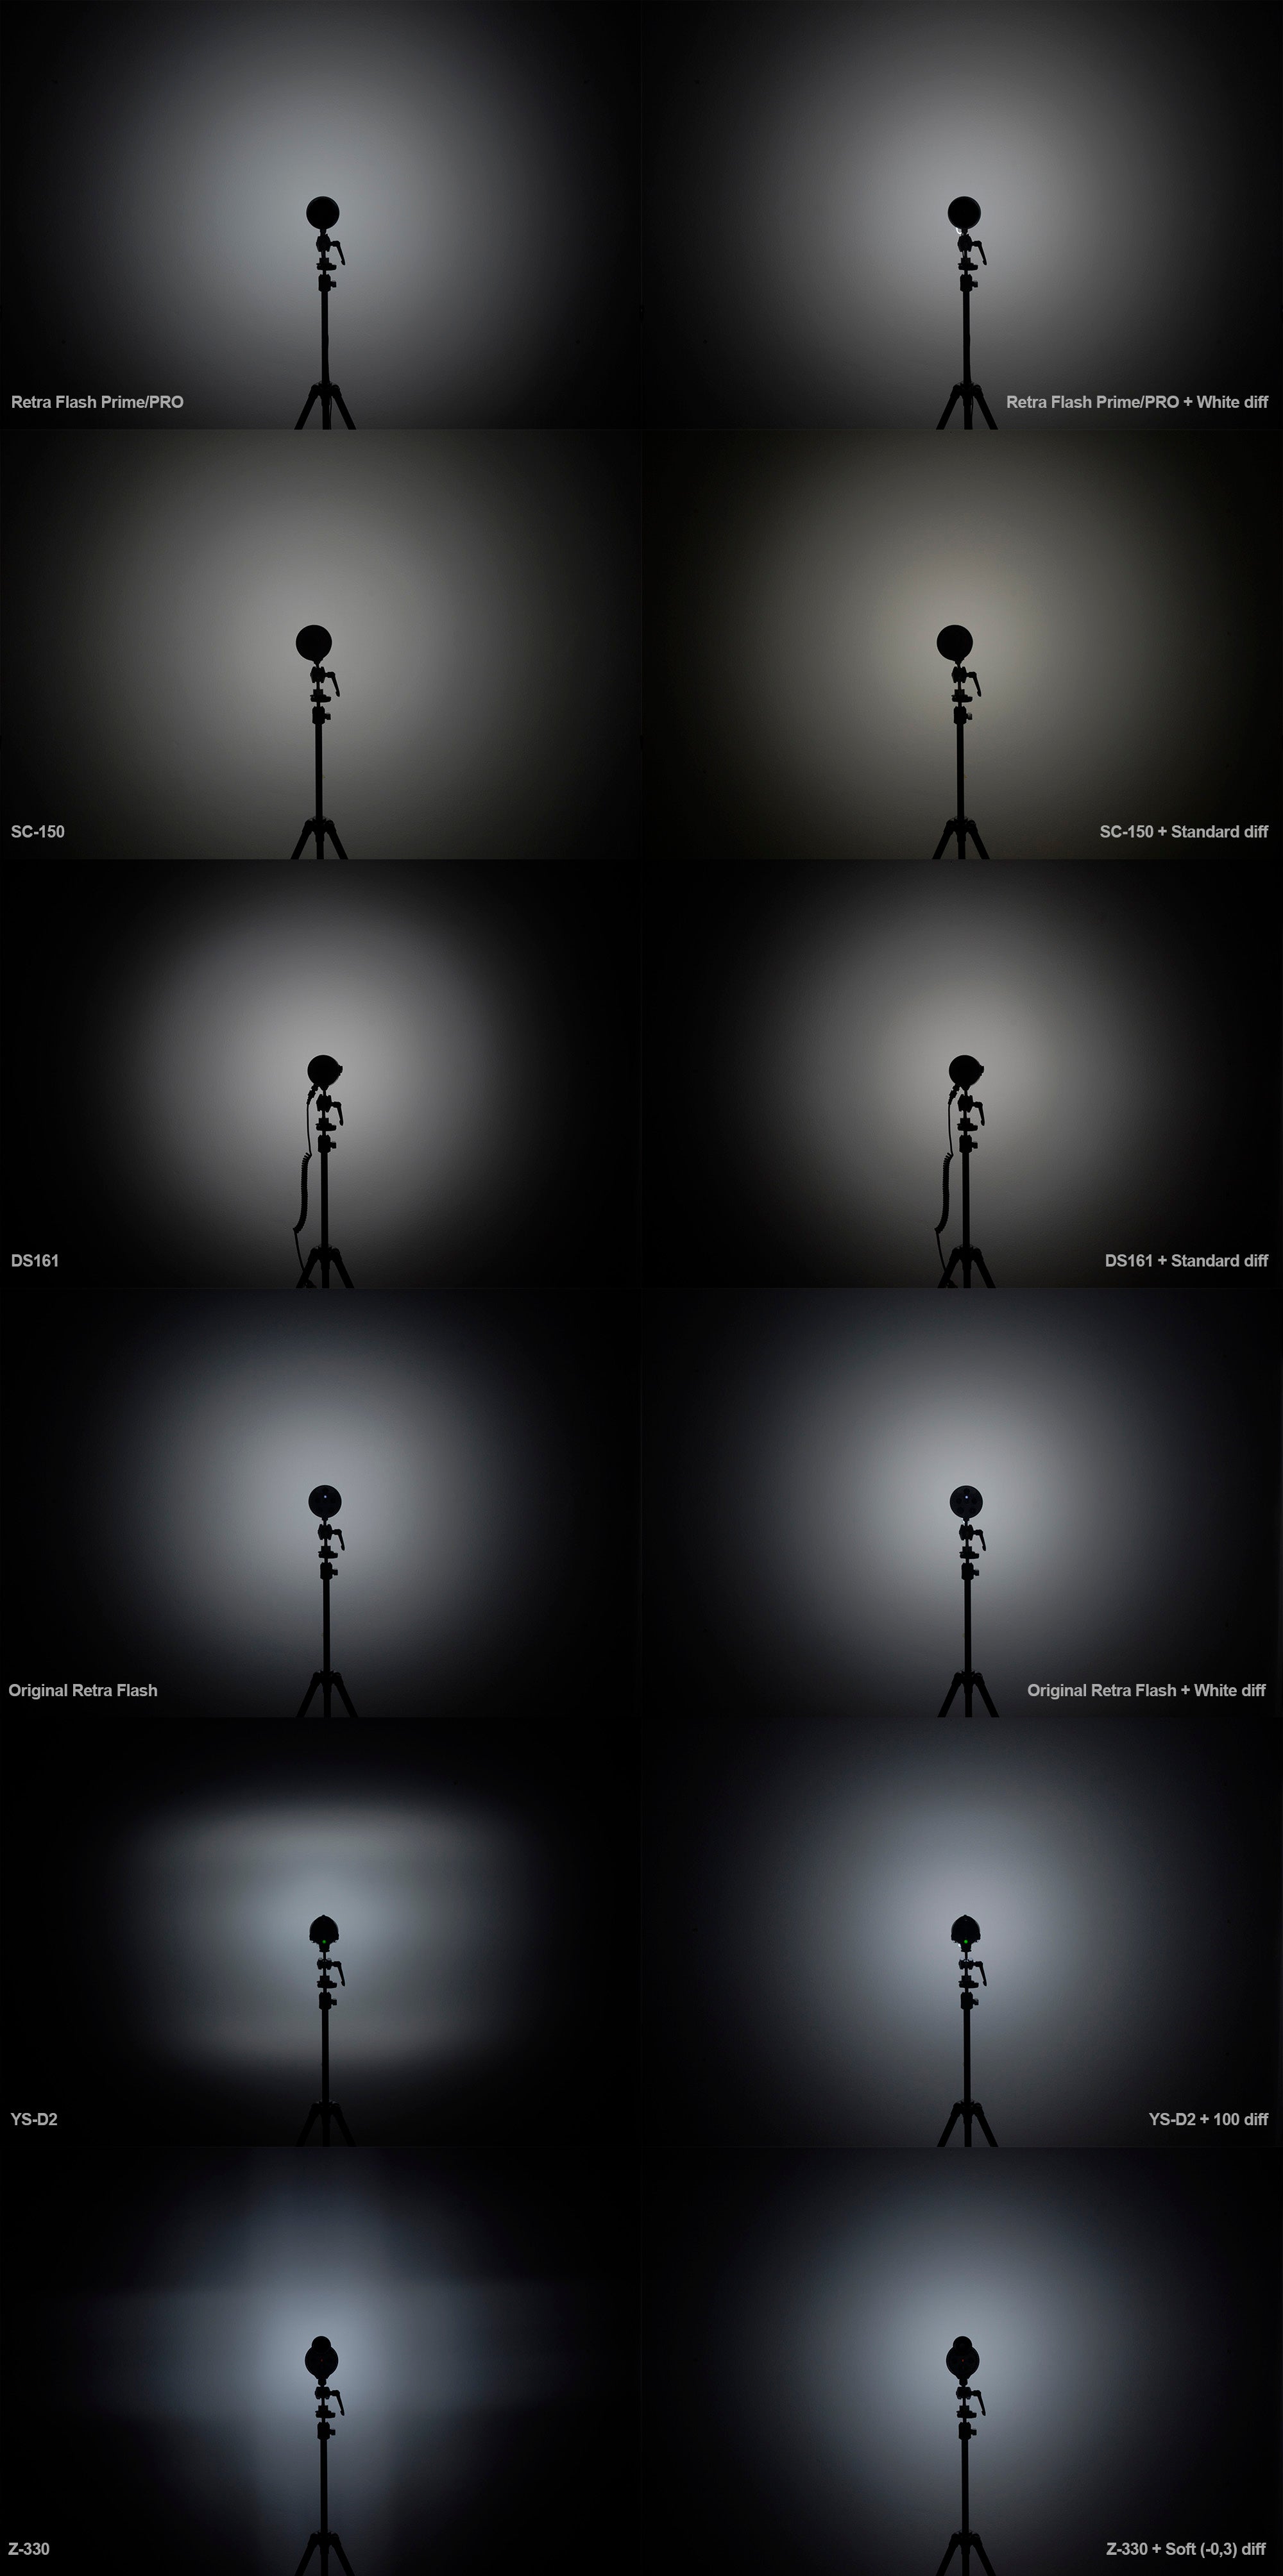
All strobes were measured in the center of the beam with a light meter (Sekonic L-478DR) and the values were dialled into the camera (±0.1 F-stop).
All strobes were positioned 60cm ±2cm (23.6in ±0.8in) from edge of strobe to wall.
Once exposure in the center of the beam is equal on all images we can observe how light decreases towards the edges and therefore the spread of the beam.
You can also see the differences in the colour temperature of the different strobes. Although color temperature is important, it is not discussed in this test.
BEAM SPREAD COMPARISON: MEASURED
60cm X 60cm ±4cm (23.6in X 23.6in ± 1.6in) squares were drawn with 15 symmetrical measurement points. All flashguns were positioned 60cm ±2cm (23.6in ±0.8in) from edge of flashgun to wall - the same setup as on the above images.
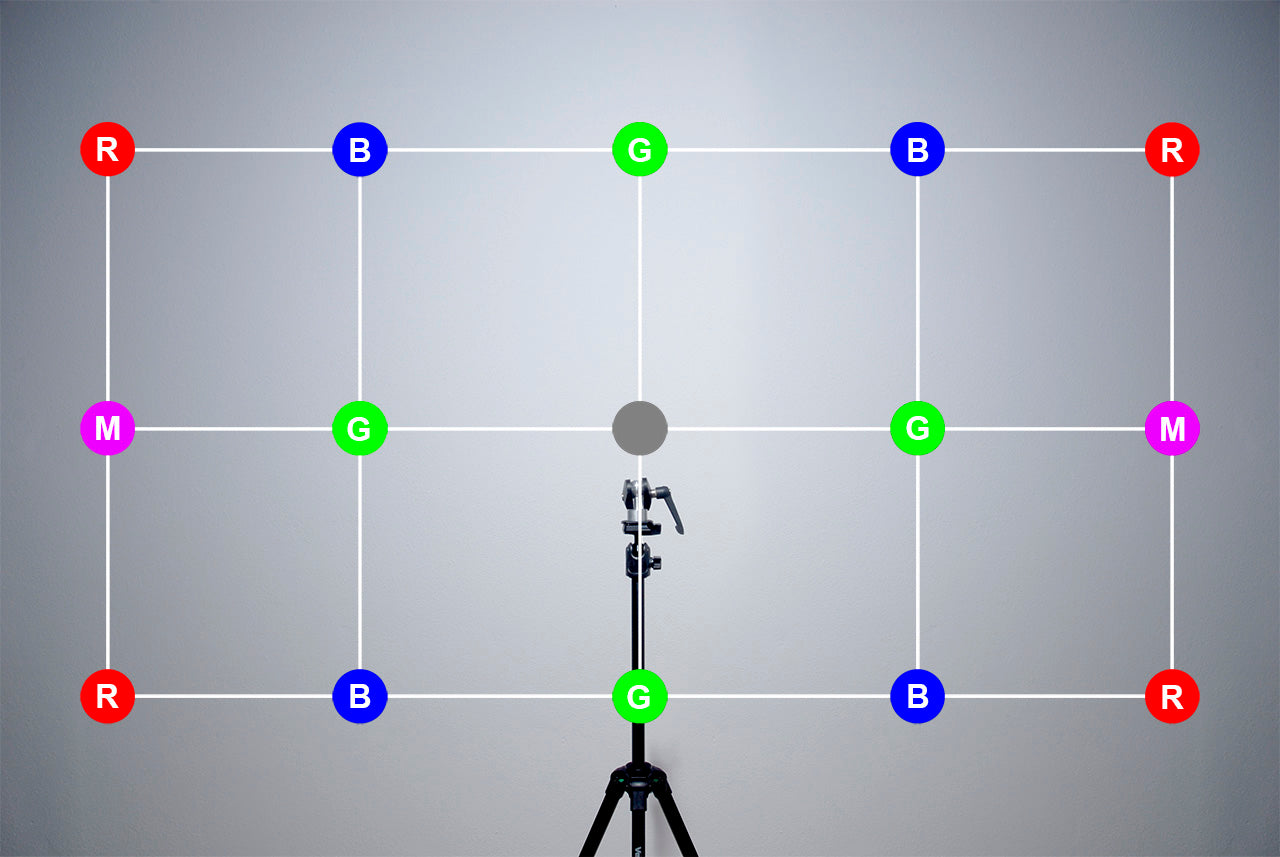
Points with the same distance from center are combined into zones:
- Zone 1 - (G)reen
- Zone 2 - (B)lue
- Zone 3 - (M)agenta
- Zone 4 - (R)ed
With a light meter (Sekonic L-478DR) we could measure F-stop numbers on 15 different points.
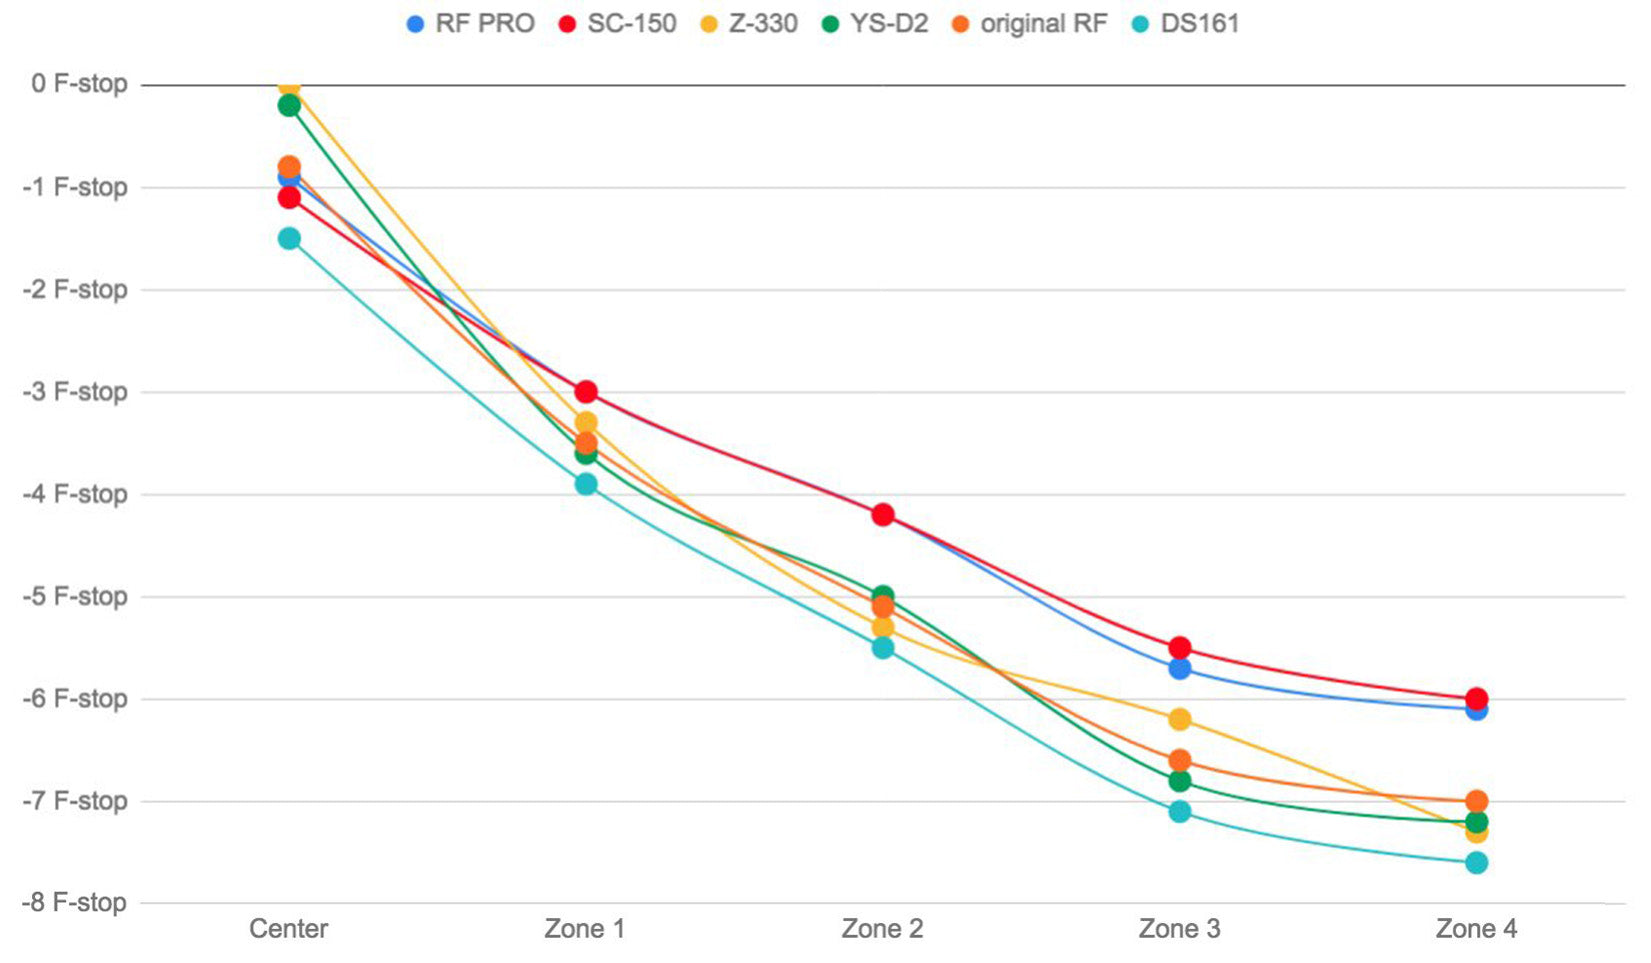
The graph below compares all strobes when set to give the same exposure in the centre of the frame, which replicates a photographer setting the strobe to give a correct exposure on the subject. All strobes lose power as the light is spread wider, but the less the light falls off, the less steep the slope of the graph, the more even the illumination.
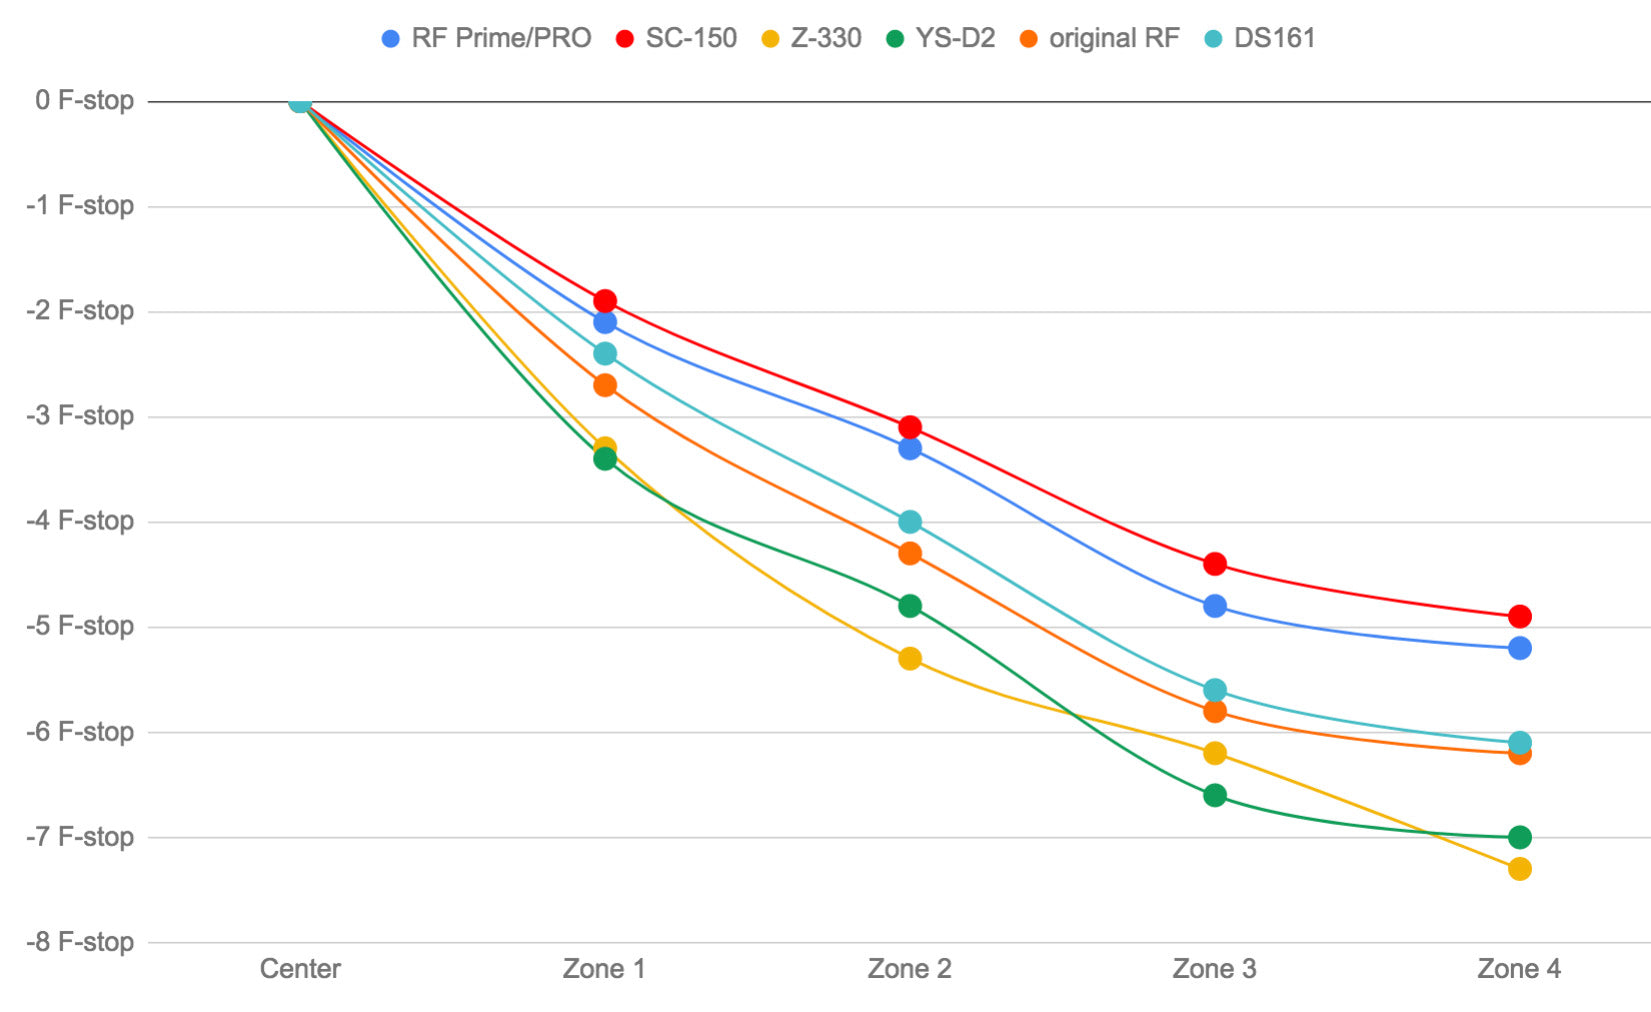
Light falls off differently toward the edges. Y-axis are F-stop numbers representing how much the power is reduced. Result deviation: ±0.15 F-stop.
The second graph below compares all strobes when set to give the maximum power. All strobes lose power as the light is spread wider, but the less the light falls off, the less steep the slope of the graph, the more even the illumination.
Strobes that emit more power in the center have a steeper fall. Y-axis are F-stop numbers representing how much the power is reduced. Result deviation: ±0.15 F-stop.
STATEMENT OF AUTHENTICITY:
Results and measurements were in no way manipulated or biased toward a single product - we have objectively measured light output from underwater strobes. All relevant testing equipment and procedures are described above. If you have any questions regarding the results please do not hesitate to contact us.

Dive into the world of underwater photography with the most advanced strobe on the market
Get yout Retra Flash Here